


Energiewerkstatt Creates New Wind Atlas in Collaboration with ESA
Published on
Share
Energiewerkstatt Creates New Wind Atlas in Collaboration with ESA
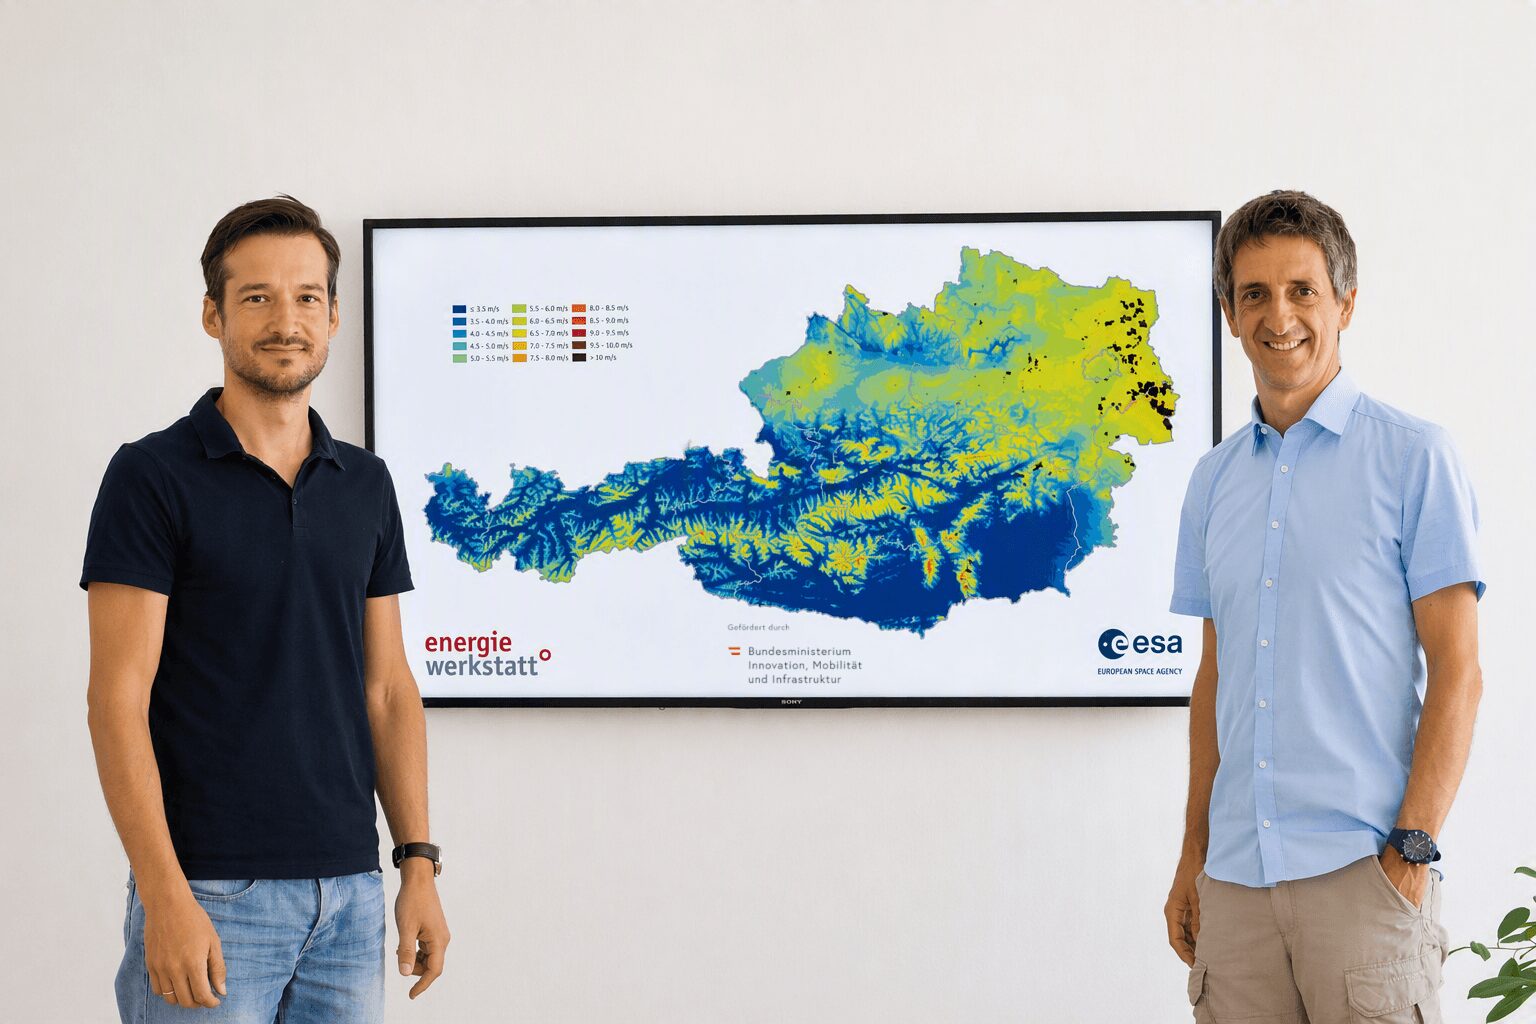
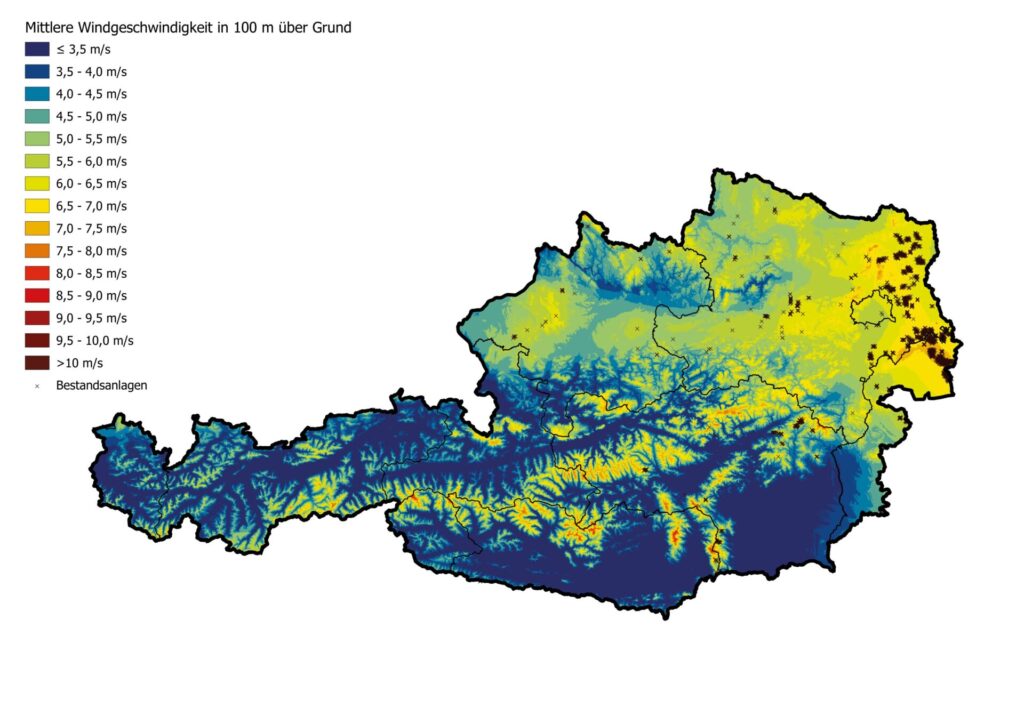
The 2026 Wind Atlas provides a new, high-resolution basis for assessing wind resources in Austria. It shows the long-term average wind speed in a 100 x 100 m grid at heights of 80, 100, 130, and 150 m above ground level. The Wind Atlas 2026 is a comprehensive, methodologically enhanced update of the 2011 Austrian Wind Atlas. It thus provides a state-of-the-art basis for comparing regional wind potential and evaluating specific sites.
ESA Cooperation
The 2026 Wind Atlas was developed as part of the GTIF-Austria activities supported by the European Space Agency (ESA). Energiewerkstatt contributed its many years of expertise in wind energy and site analysis to the project and was responsible for the technical work involved in updating the Austrian Wind Atlas and assessing wind resources.
What is GTIF?
GTIF:“Green Transition Information Factories.”
The initiative uses Earth observation and geospatial data to develop specific digital tools for the energy transition. These tools help government agencies, planners, and companies assess potential and make informed decisions. The Wind Atlas 2026 is one such application.
The collaboration with the European Space Agency (ESA) underscores the project’s high professional and technical standards. ESA projects place high demands on methodology, data quality, traceability, and reliable implementation. At the same time, the data products developed are compatible with European standards and infrastructures.
Key Findings: Additional Areas of Potential in Several Regions
When considering areas with an average wind speed of more than 5 m/s at a height of 100 m that also show a positive deviation from the previous wind atlas, areas become apparent that have tended to be underestimated in the past and may be of interest for future wind power projects.
In Upper Austria , the southern Traunviertel region and the northern and northeastern Mühlviertel regions stand out —all of which are areas within the designated wind power exclusion zones. In Carinthia , Soboth in the east is becoming significantly more important. In the west as well, the areas stretching from the Ankogel Group to the Schober Group are becoming more prominent. In the border region between Lower Austria and Styria, large areas are emerging where wind power quality must be reassessed. At the municipal level, the positive deviations sometimes reach values of around 1 m/s.
Other areas of interest in Salzburg extend from the Loferer and Leoganger Steinberge to the Berchtesgaden Alps. In Tyrol, the southern border regions near the Ötztal and Zillertal Alps in particular are areas where wind potential appears to be greater than previously assumed. In contrast, the Lechtal and Stubai Alps show significantly lower potential than previously assumed.
Method
COSMO-CLM climate simulations form the meteorological basis. COSMO-CLM is the climate version of the regional weather model COSMO and is used for regional climate simulations. Such models translate large-scale atmospheric boundary conditions to a finer regional scale, thereby representing processes such as terrain, land surface, and regional flow patterns in greater detail than global models.
To derive a map base that can be used for planning and regional assessment, a multi-step process chain was established:
- Statistical Downscaling
- Geostatistical Correction
- Machine Learning Correction
1. Downscaling
In the first step, the regional climate data (COSMO-CLM), which have a coarse spatial resolution on the order of kilometers , are statistically downsampled to a 100 x 100 m grid.
This downscaling is based on a GAM ( Generalized Additive Model). The model captures spatially variable relationships between location, elevation, and wind speed. This preserves the large-scale climate signature while accounting for the elevation structure of the terrain in much greater detail.
2. Geostatistical Correction
The map is then corrected using wind measurement data. Regional variations are modeled using kriging as a comprehensive correction factor . The quality of the individual measuring stations is explicitly taken into account: Reliable measurements have a greater impact, while less reliable data are given less weight. In this way, measurement data is utilized without uncritically adopting local artifacts or contradictory data.
What is kriging?
Kriging is a geostatistical method used to extrapolate measured values spatially. In the Wind Atlas, the variations observed at individual measuring stations are used to calculate a corrected value for the areas in between as well.
3. Machine Learning Correction
Next, a machine learning correction using Bayesian Additive Regression Trees (BART) is applied. It identifies and corrects local, nonlinear relationships between model deviations, various topographic variables, and land cover.
Validation
The entire model chain was validated using leave-one-out cross-validation. This results in the following standard deviations of the calculated deviations as a measure of uncertainty in the wind map for the regions where wind power is predominant: Lower Austria 0.45 m/s, Burgenland 0.49 m/s, Styria 0.69 m/s.
The 2026 Wind Atlas is available to the public
The 2026 Wind Atlas thus combines a consistent long-term climatological baseline, local measurement data, modern statistical methods, and high-resolution satellite- and remote-sensing-based geodata to form a reliable foundation.
The freely accessible online maps enable experts, government agencies, project developers, and the interested public to compare regional wind conditions, identify areas with potential, and narrow down regions for further investigation. For specific wind power projects, however, the atlas does not replace site-specific wind measurements or the assessment of nature conservation, land-use planning, infrastructure development, grid connection, and regulatory approval.
Do you have questions about the Wind Atlas 2026 or other Energiewerkstatt projects related to wind power?
Just send us an email or give us a call. We look forward to hearing from you:
Phone: +43 (0)7746 / 28212/0
Email: florian.pfannhofer@energiewerkstatt.org
The results of the 2026 Wind Atlas are available at: